Results
Here can be found all the charts for each option.
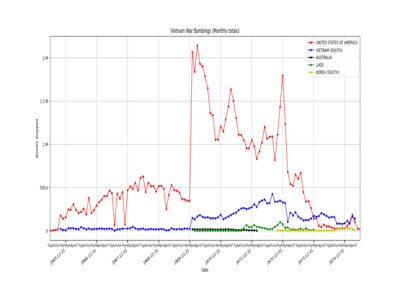
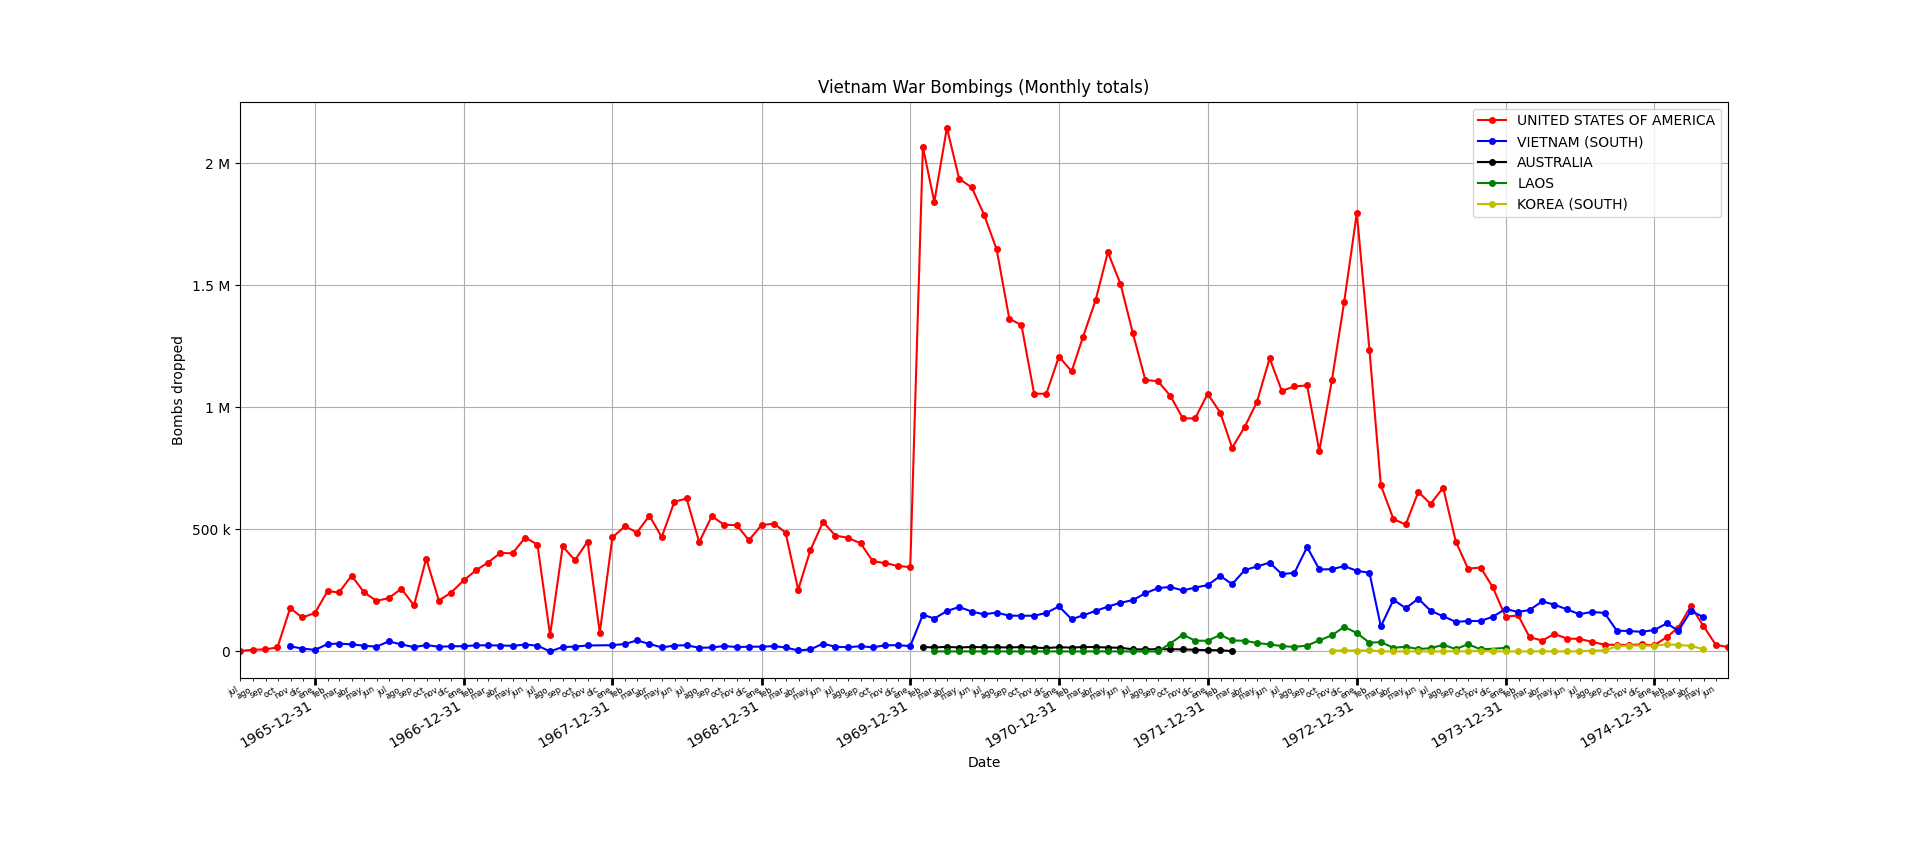
Vietnam War Bombings (Monthly totals)
Option 1
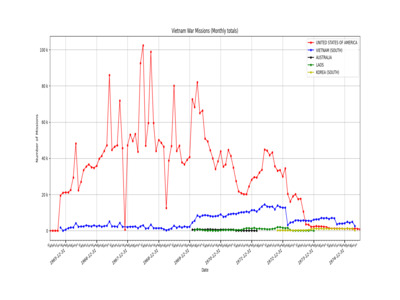
Vietnam War Missions (Monthly totals)
Option 2

Vietnam War Bombings (Totals by Country)
Option 3
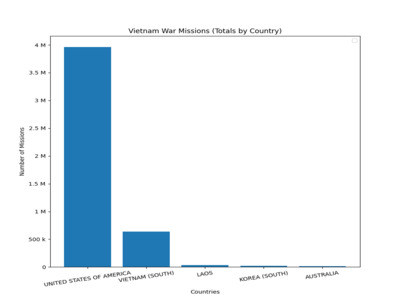
Vietnam War Missions (Totals by Country)
Option 4
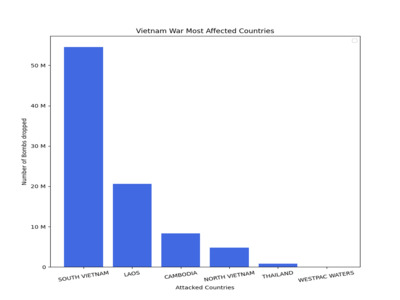
Vietnam War Most affected Countries
Option 5
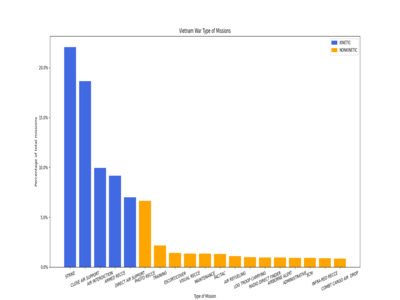
Vietnam War Type of Missions
Option 6

Vietnam War Bombings Locations By Date
Option 7

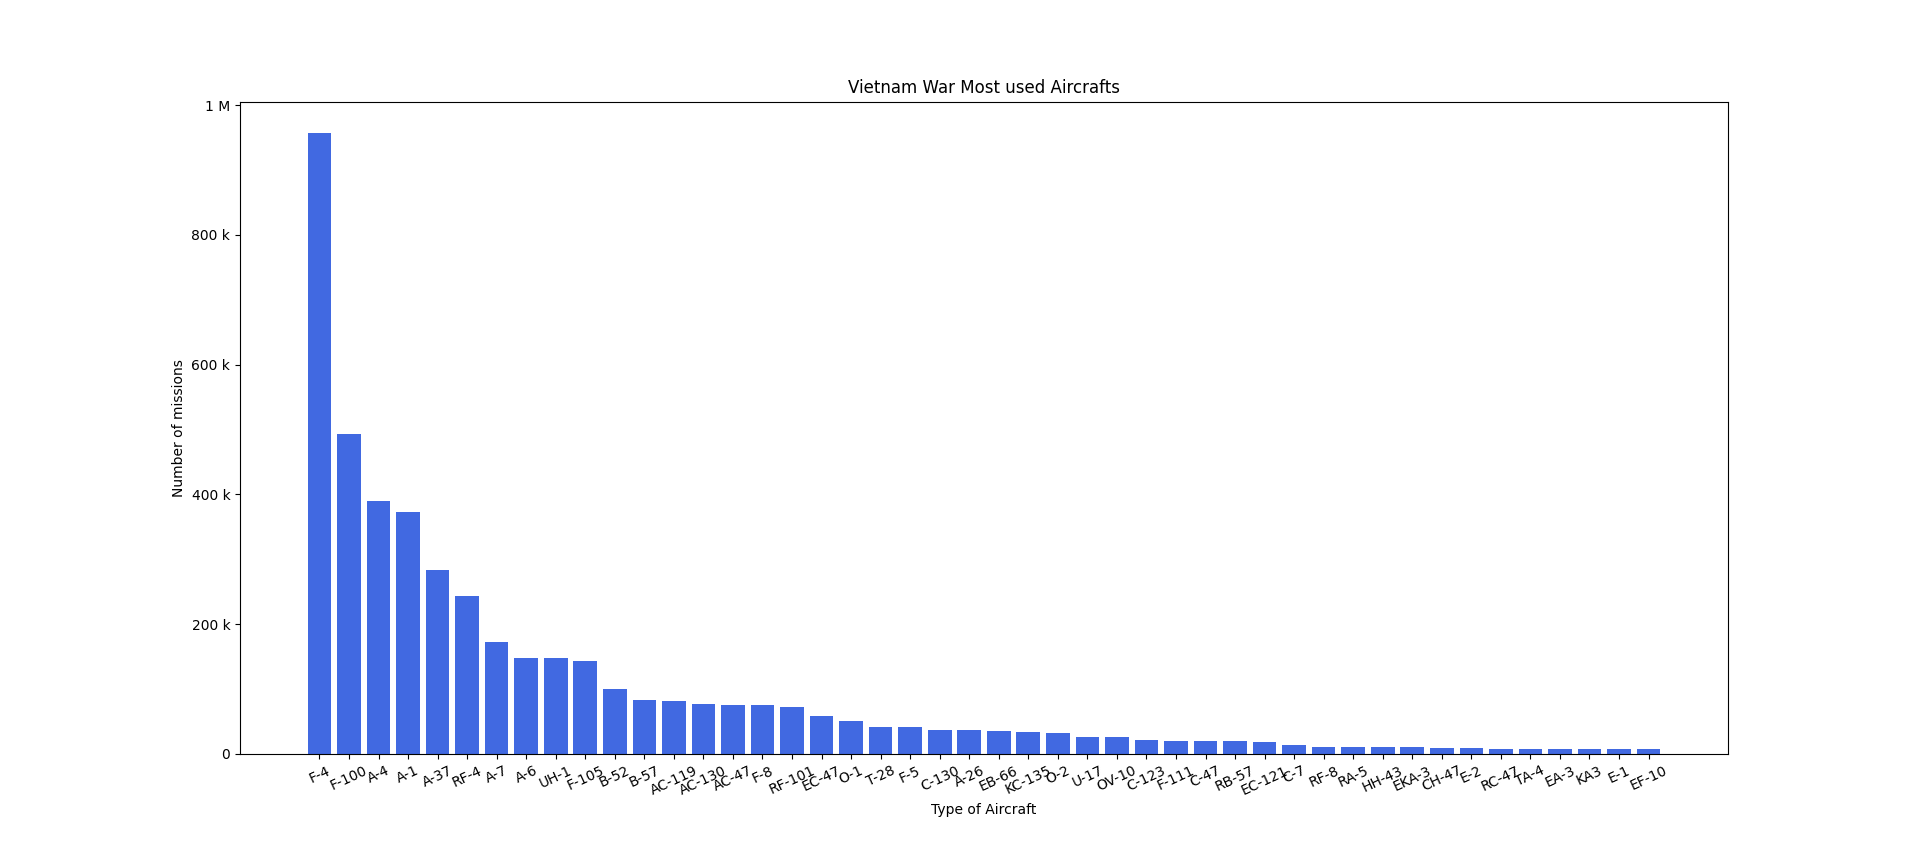
Vietnam War Most used Aircrafts
Option 8

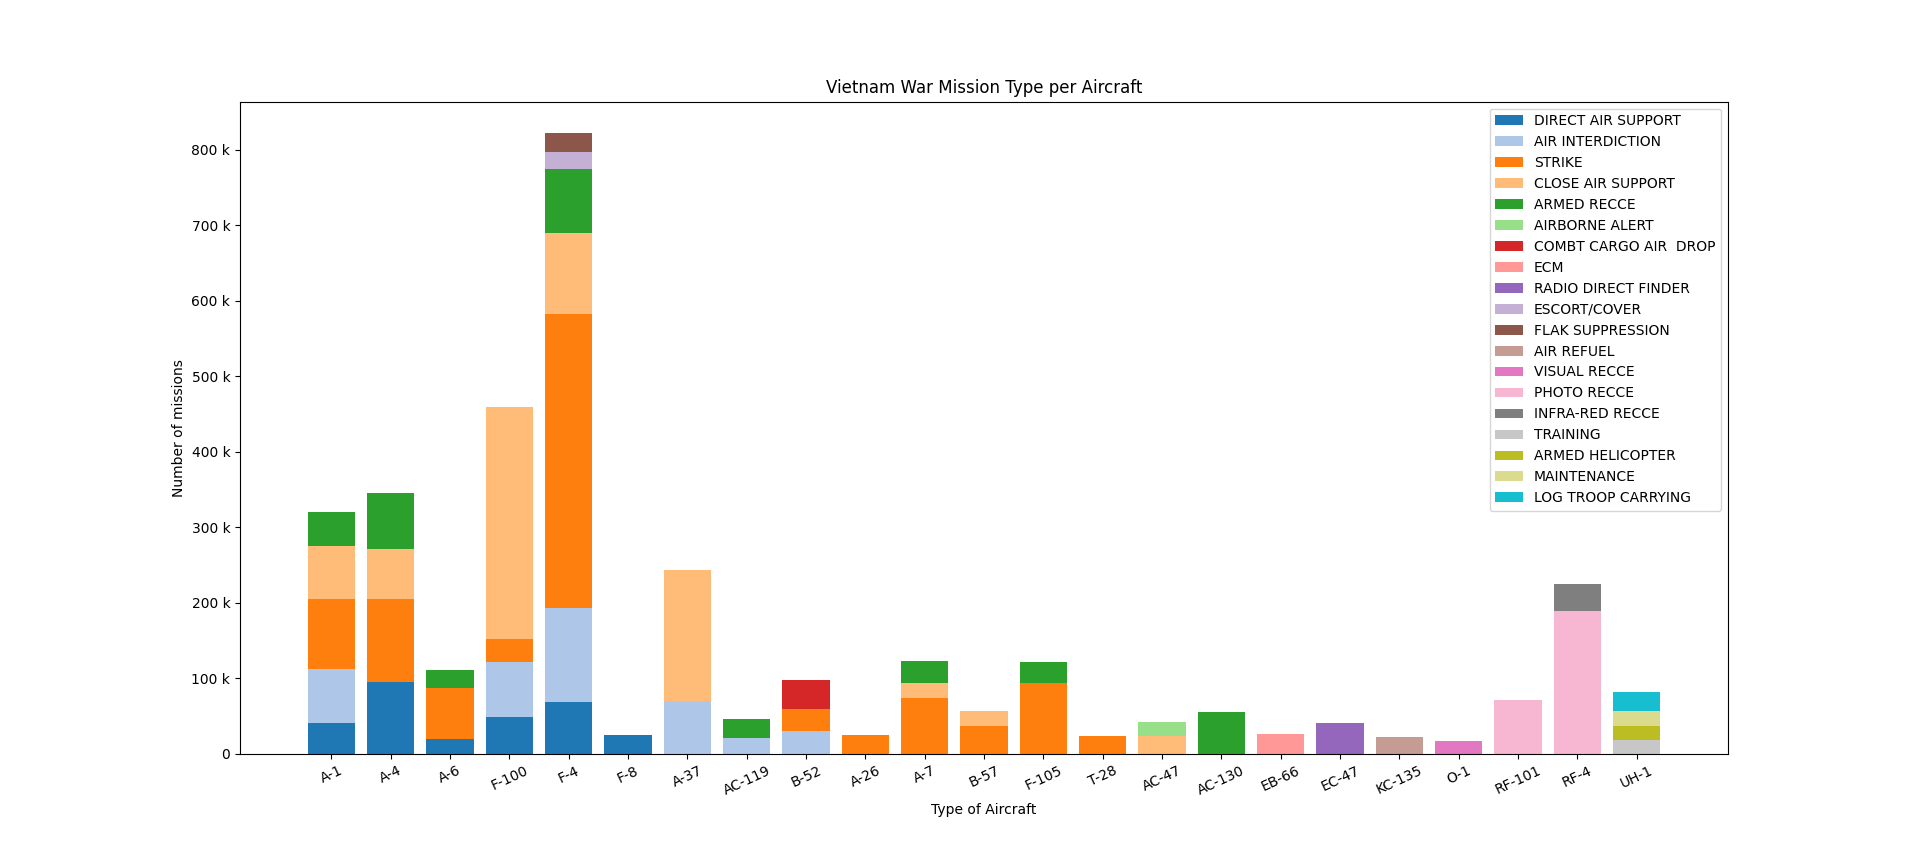
Vietnam War Mission Type per Aircraft
Option 9
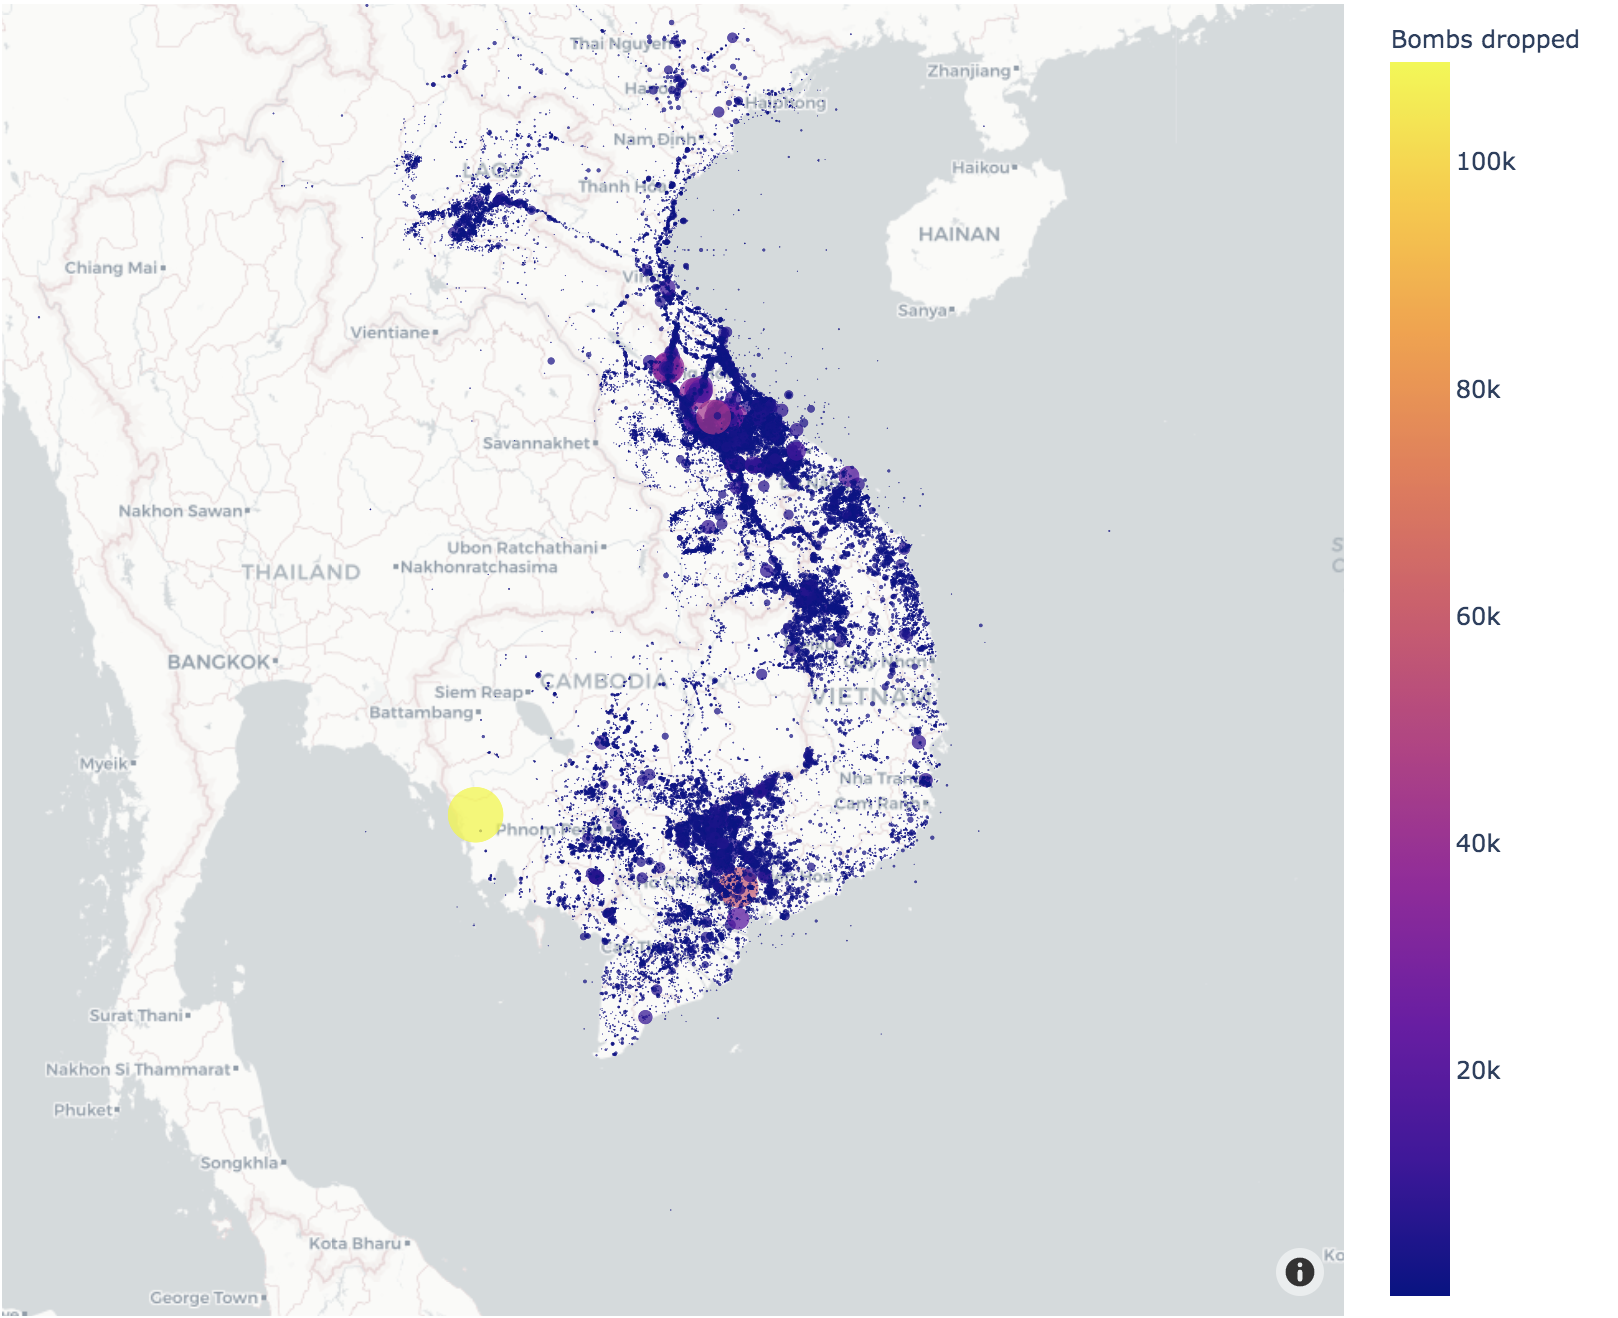
Vietnam War Bombings Locations
Option 10
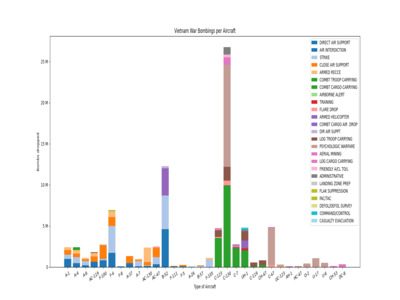
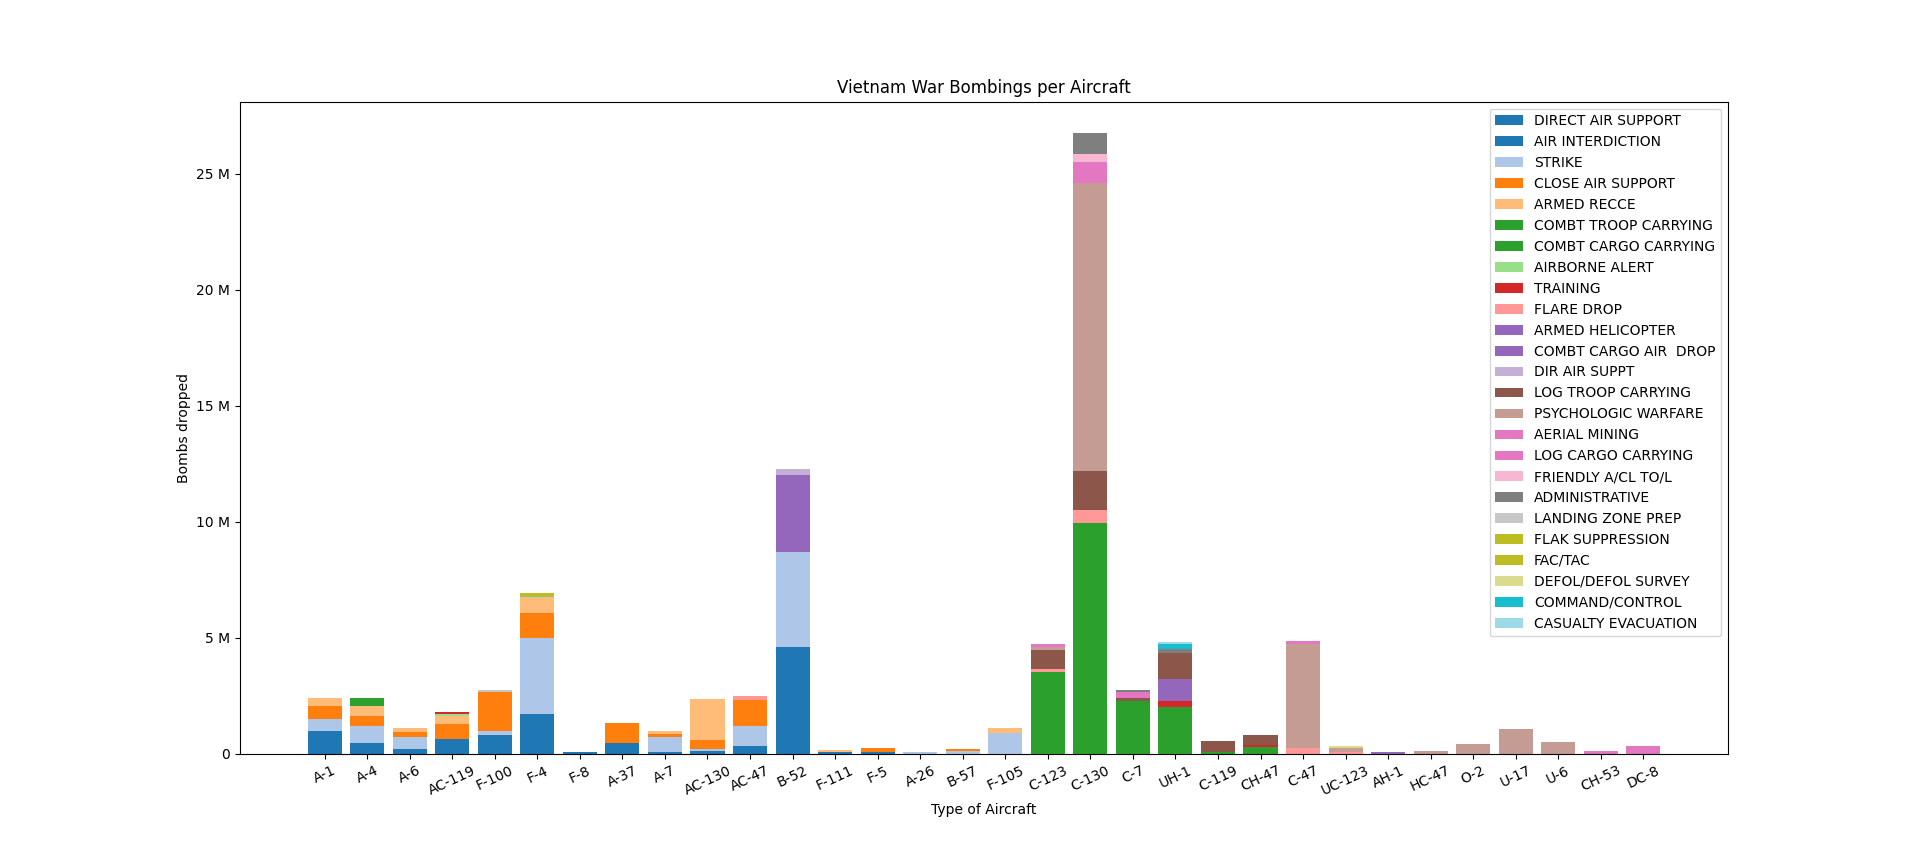
Vietnam War Bombings per Aircrafts
Option 11

Vietnam War Most Common Take-off Locations
Option 12
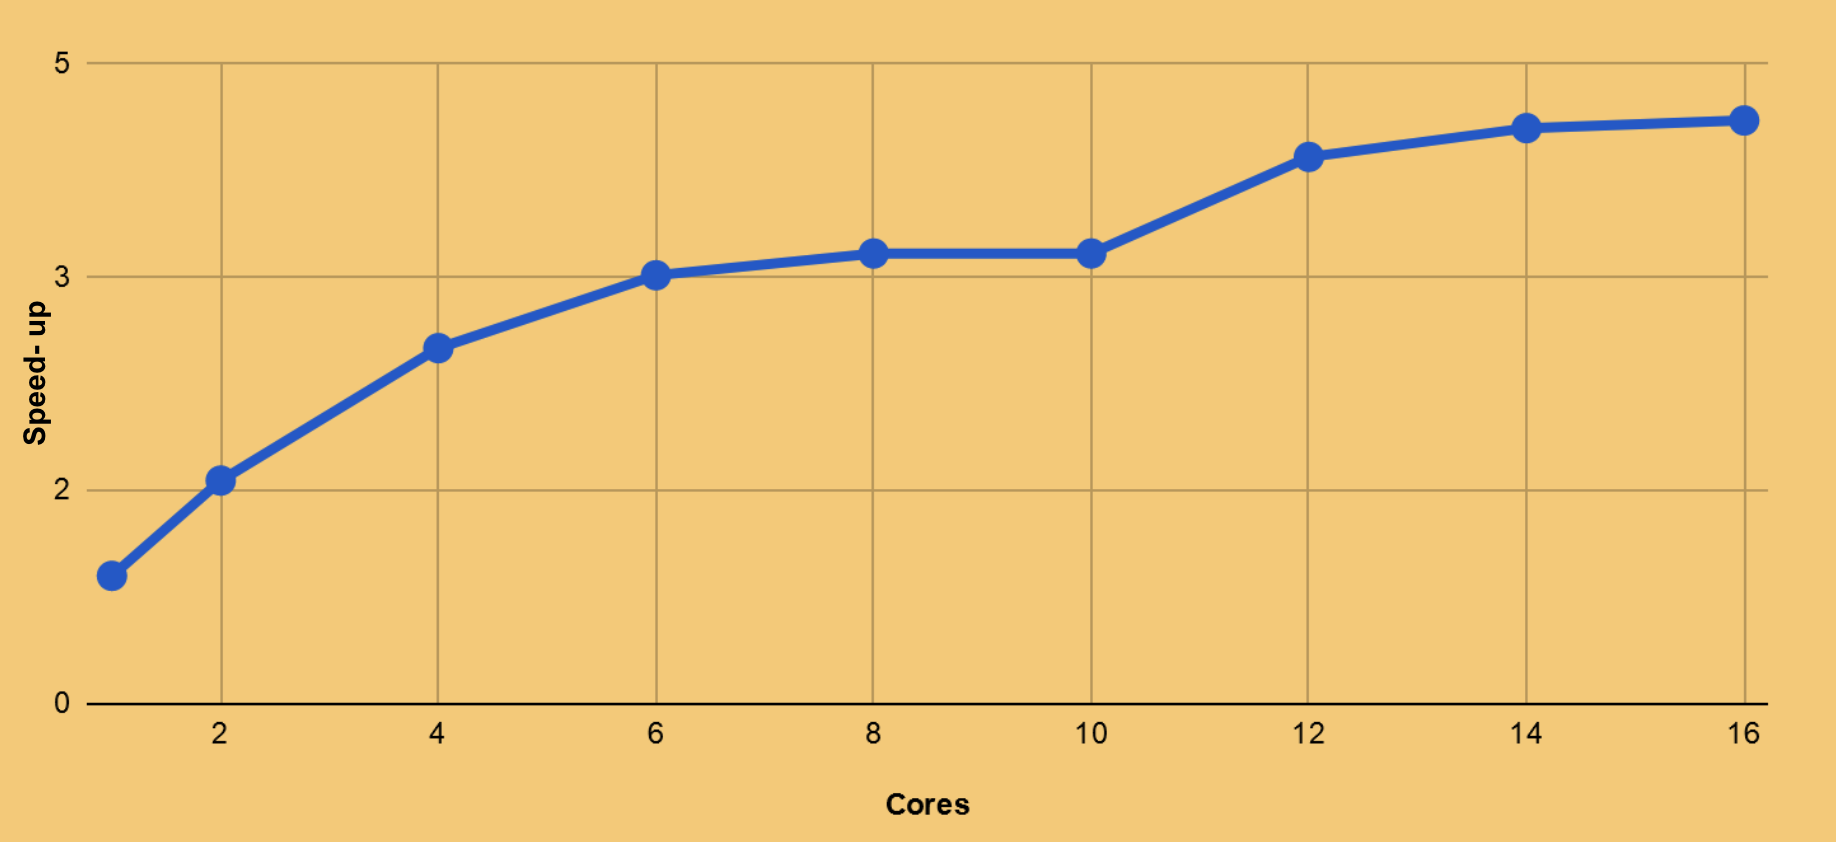
PERFORMANCE
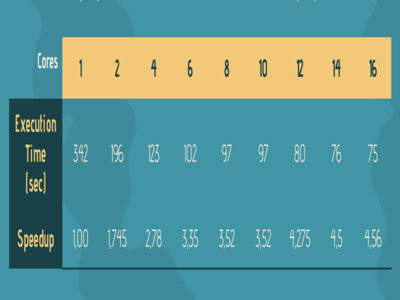
Performance Evaluation

Speed-Up